ETH & BTC.D
26/10 TA updates

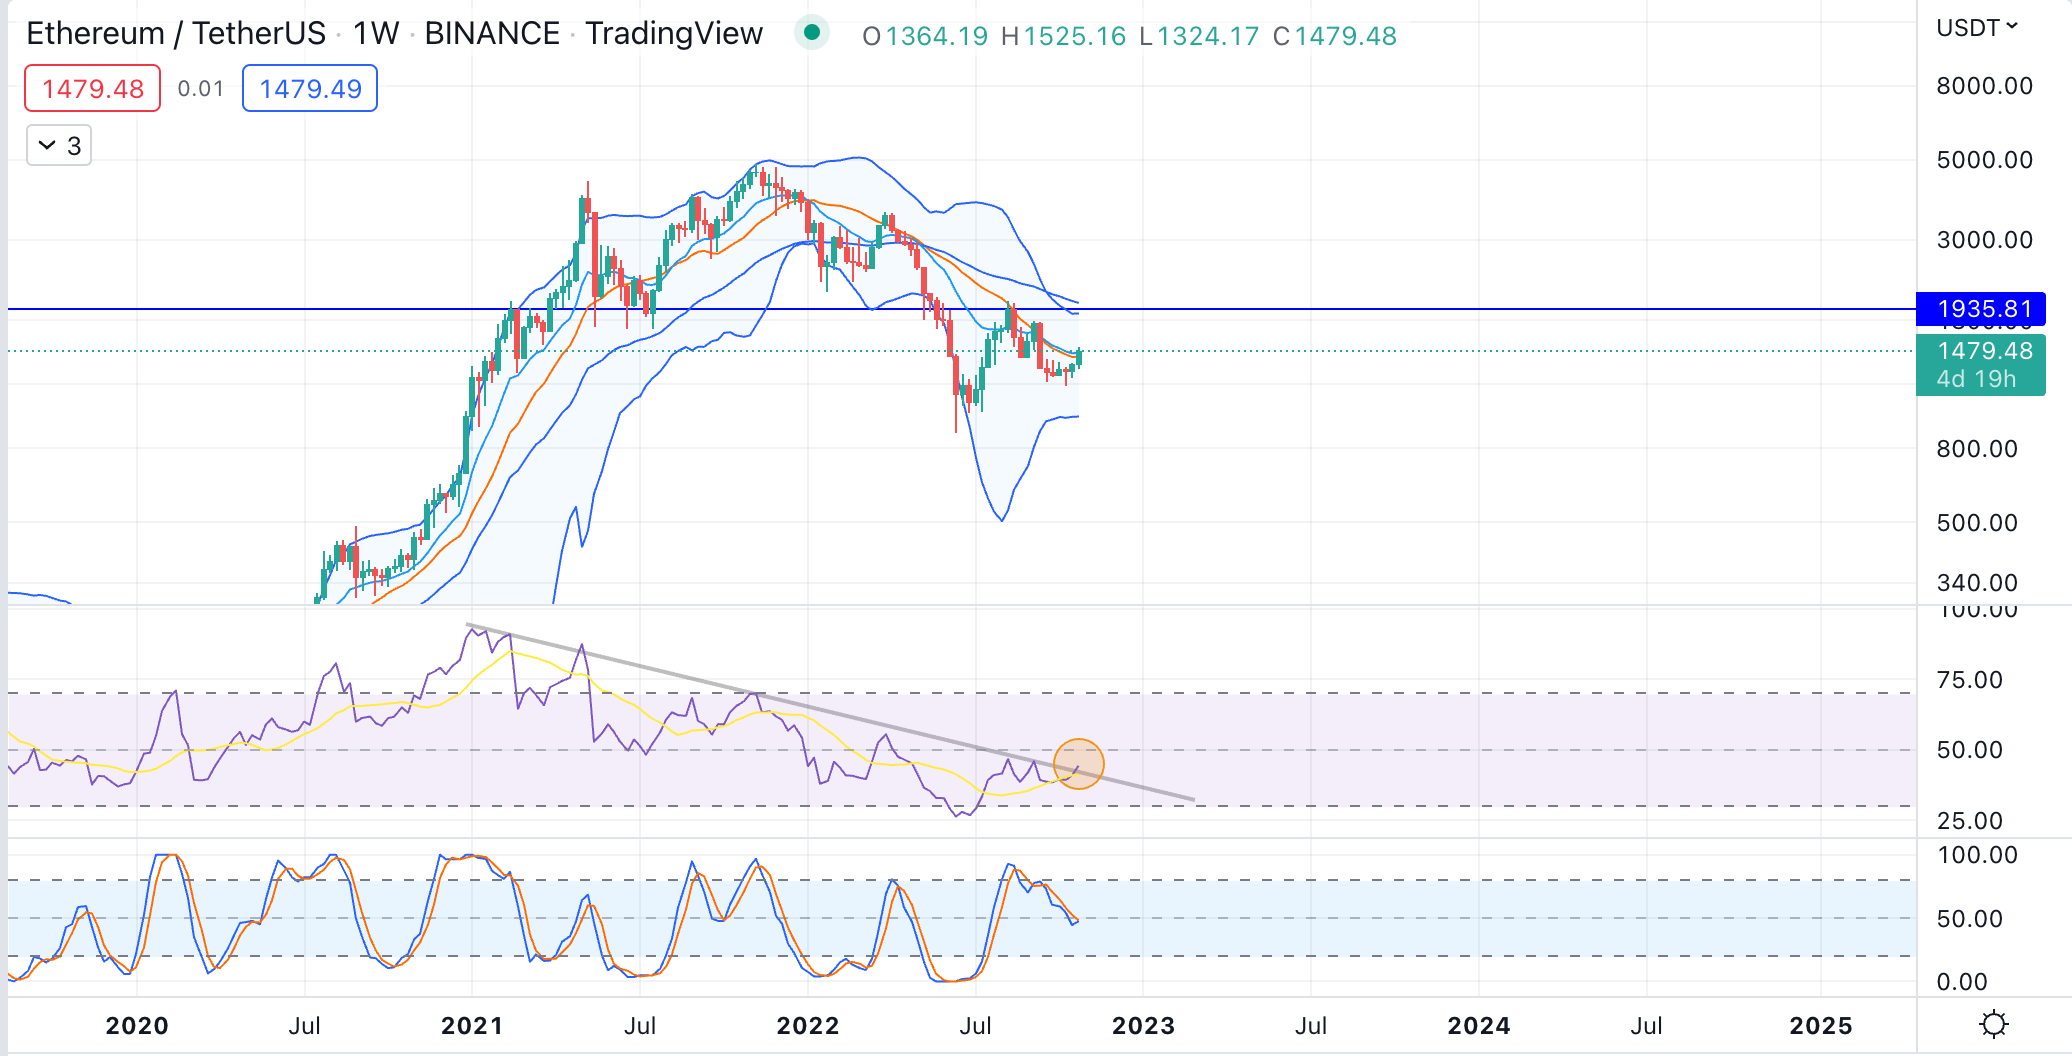
Finally some volatility after a month of sideways PA in ETH, and yesterday’s pump does put bulls in the driving seat at the moment, & here are some convincing charts starting from higher time frame weekly ETH/USDT rsi breaking out (Yellow circle) from its resistance, this signal a HTF trend shift is happening as we speak, especially when ETH reclaims above its 2017 ath price, a strong close on the weekly will definitely invite momentum chasers.
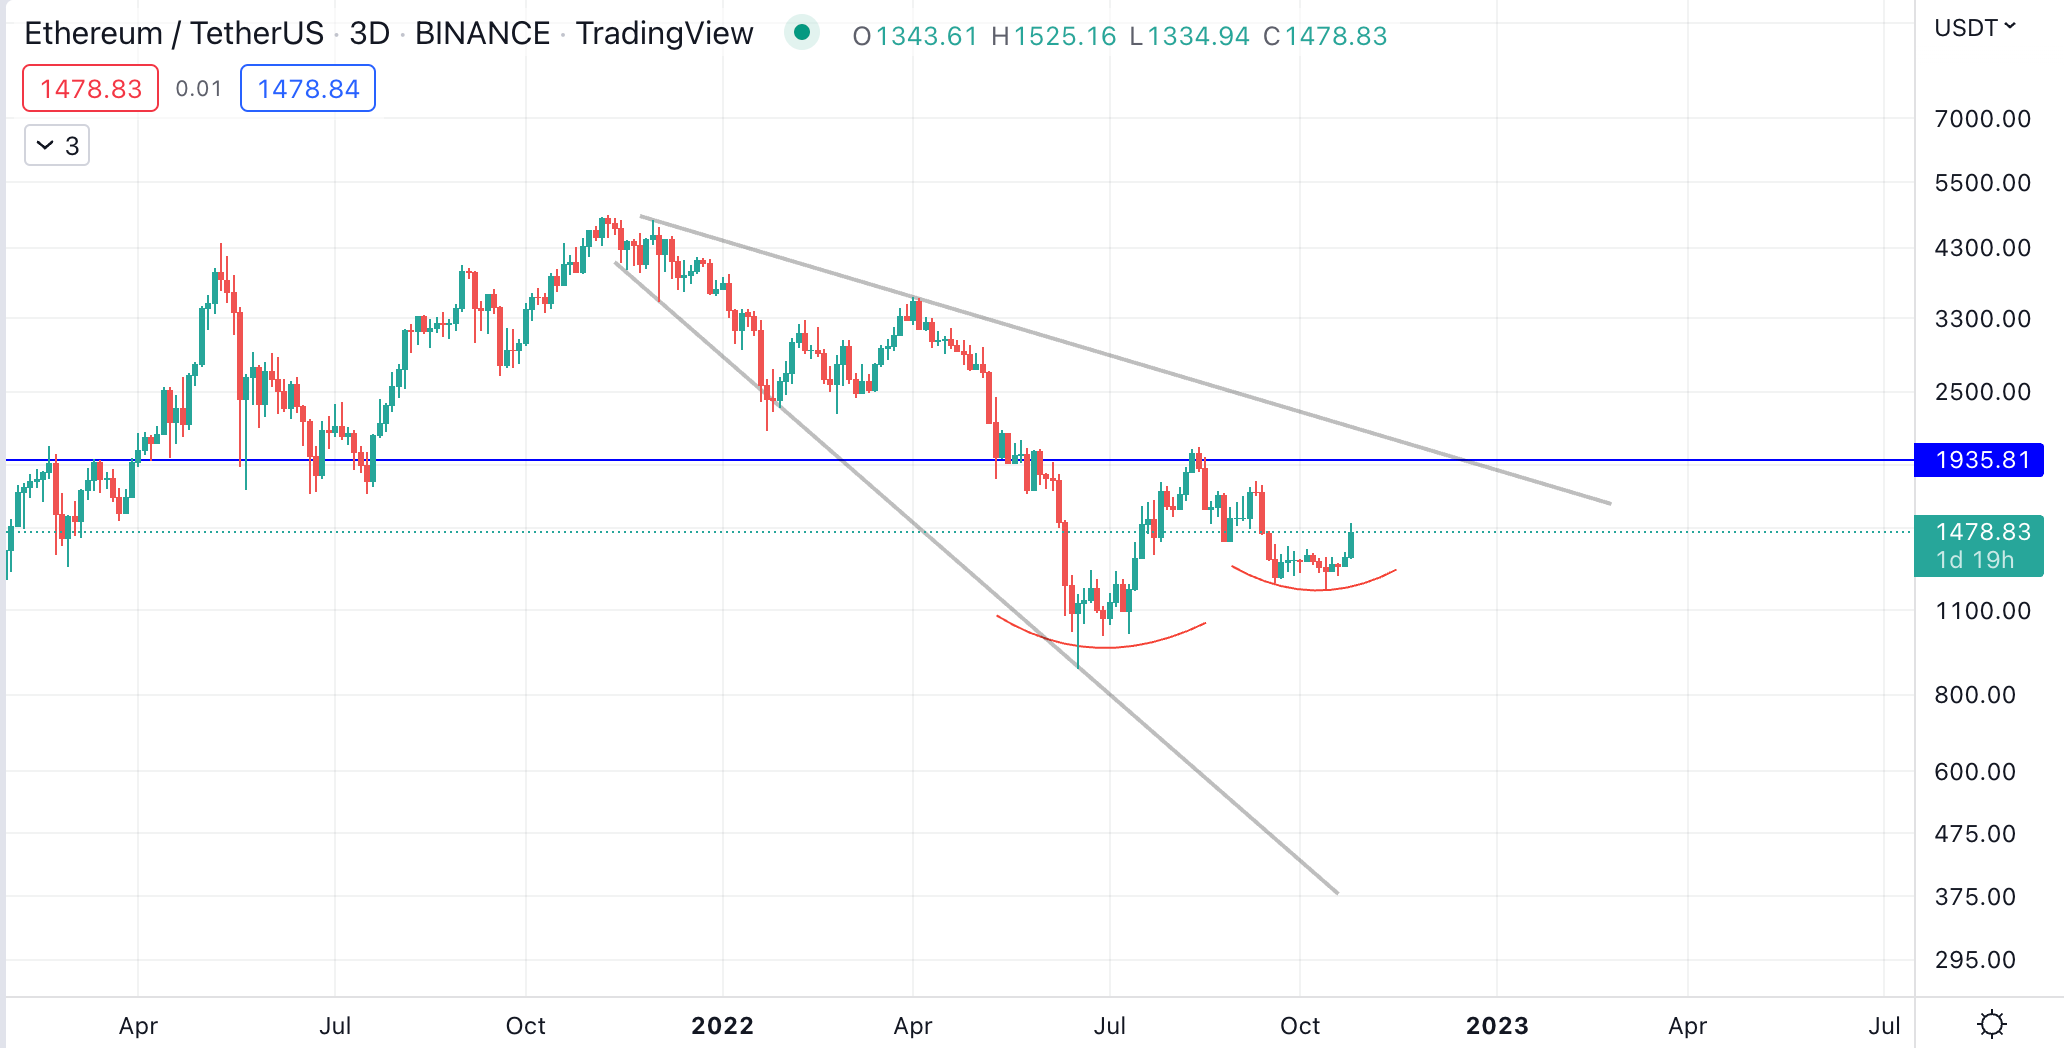
closing into 3D chart we can see that ETH is forming a higher low in a descending broadening wedge.
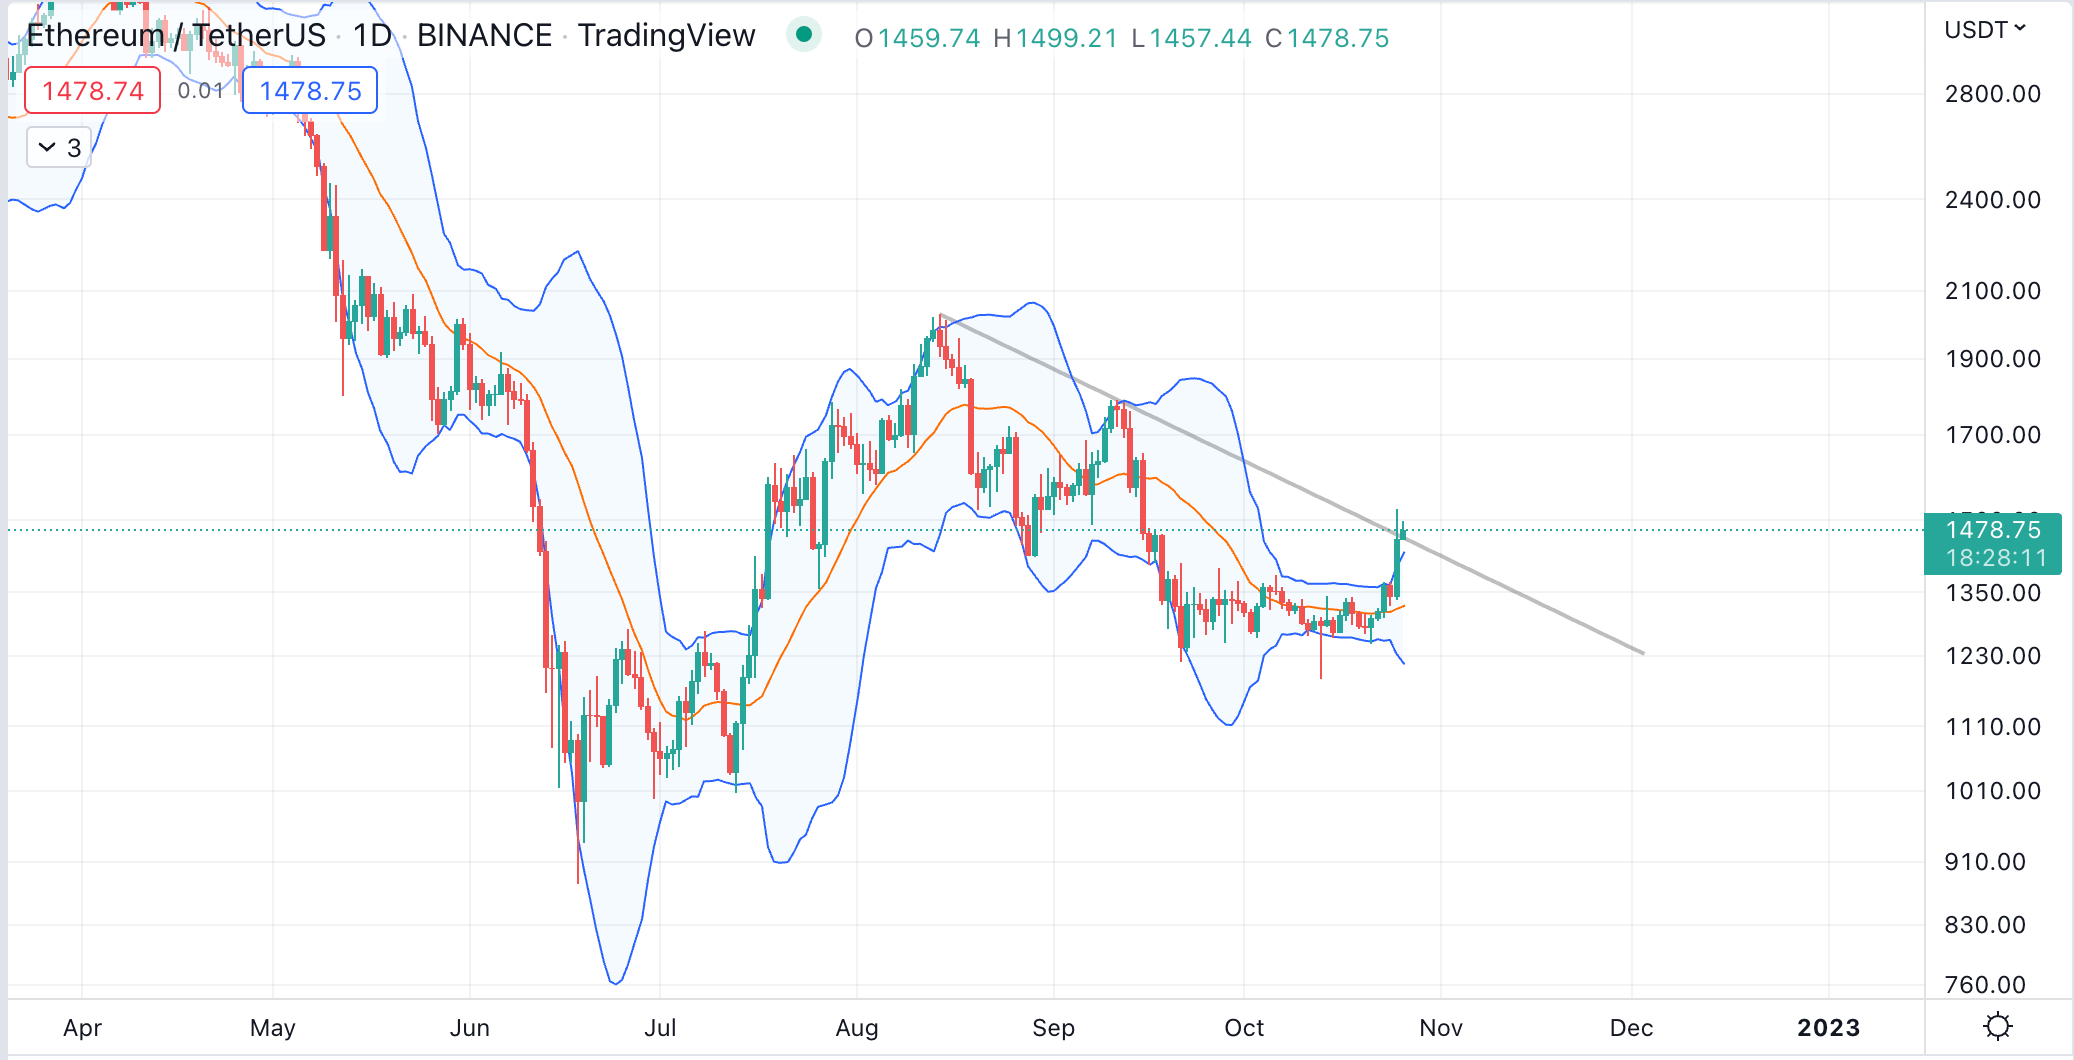
However if you’re trying to scale in do note that we are above the daily Bollinger Band, which could stall here (short term), I’ve also added a lower time frame diagonal resistance which was taken out yesterday. In short Eth needs to close and maintain above this new diagonal support to continue trending upwards.
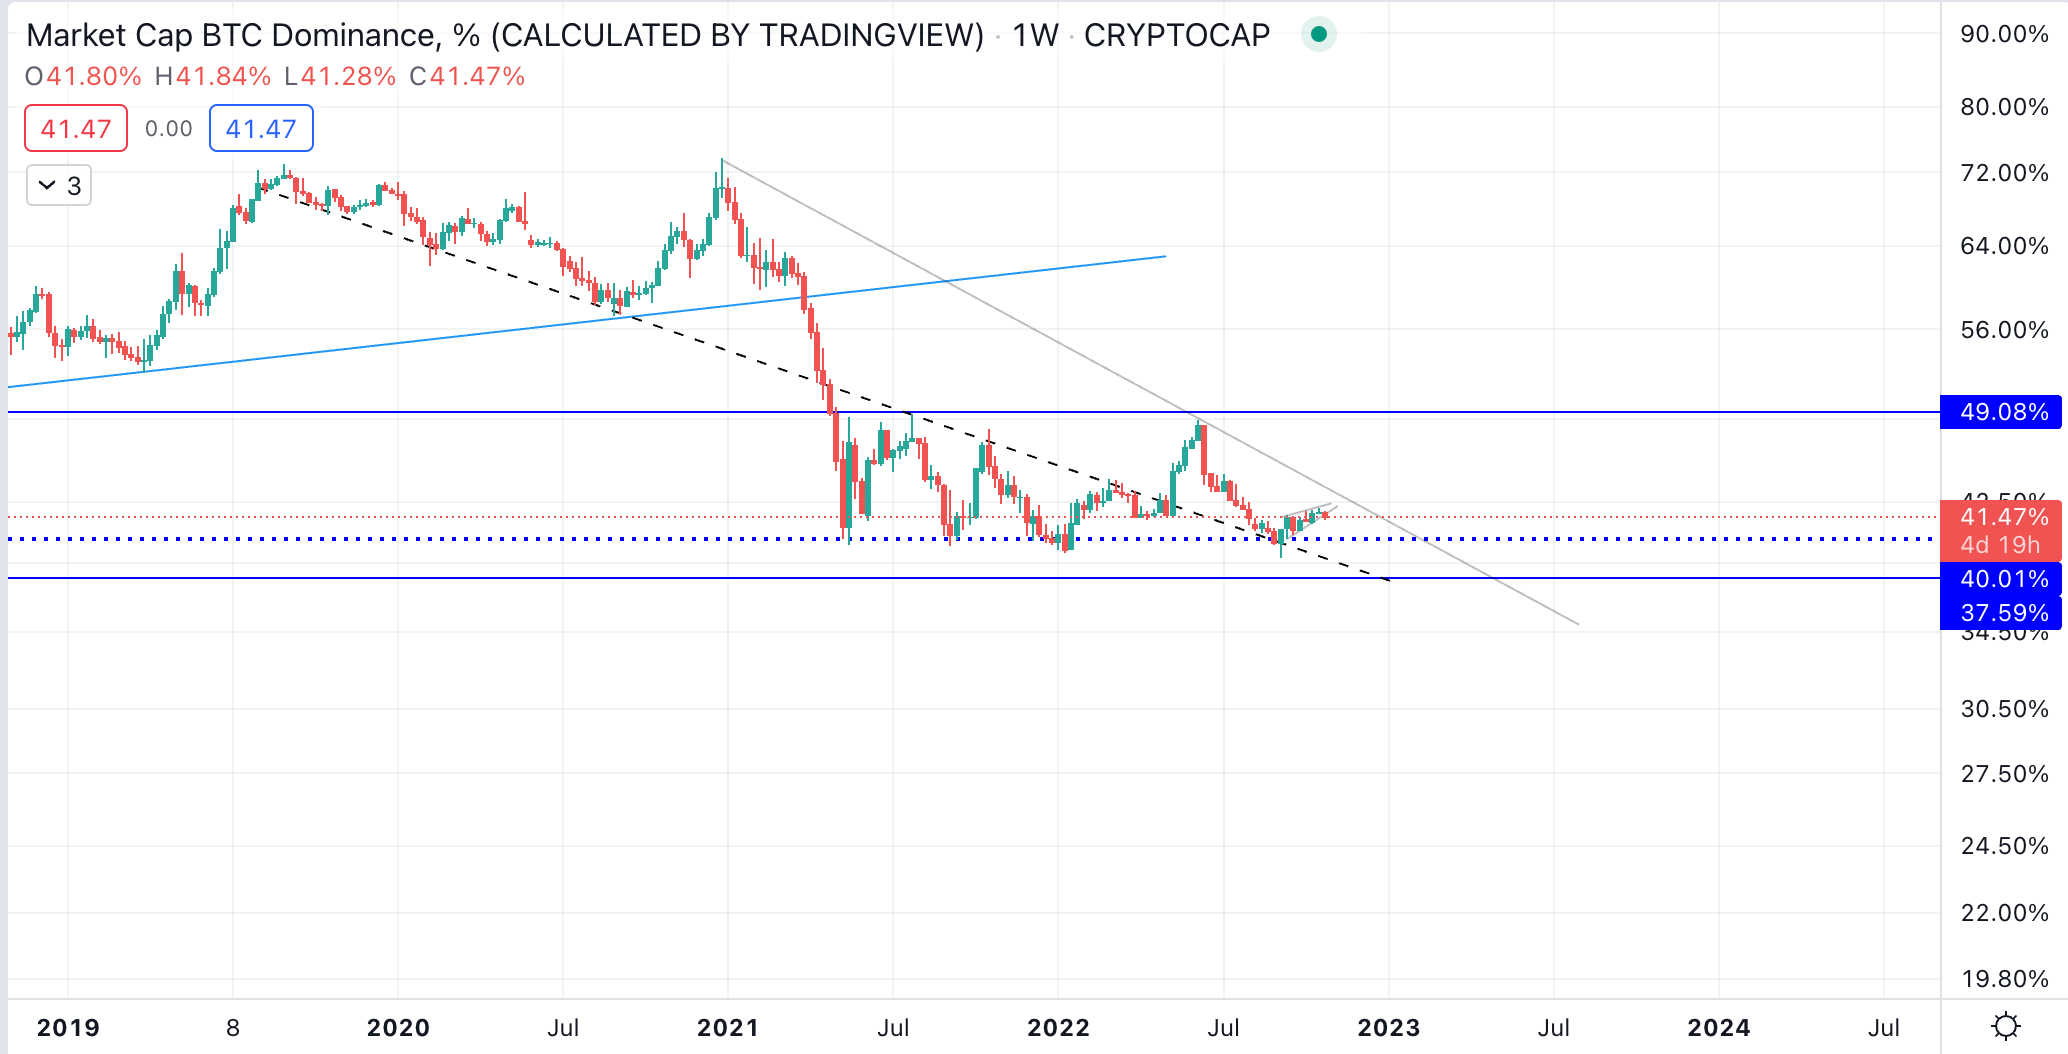
For confluence factors, Btc dominance have broken below it’s lower time frame ascending narrowing wedge, which should provide relief to alt coins.
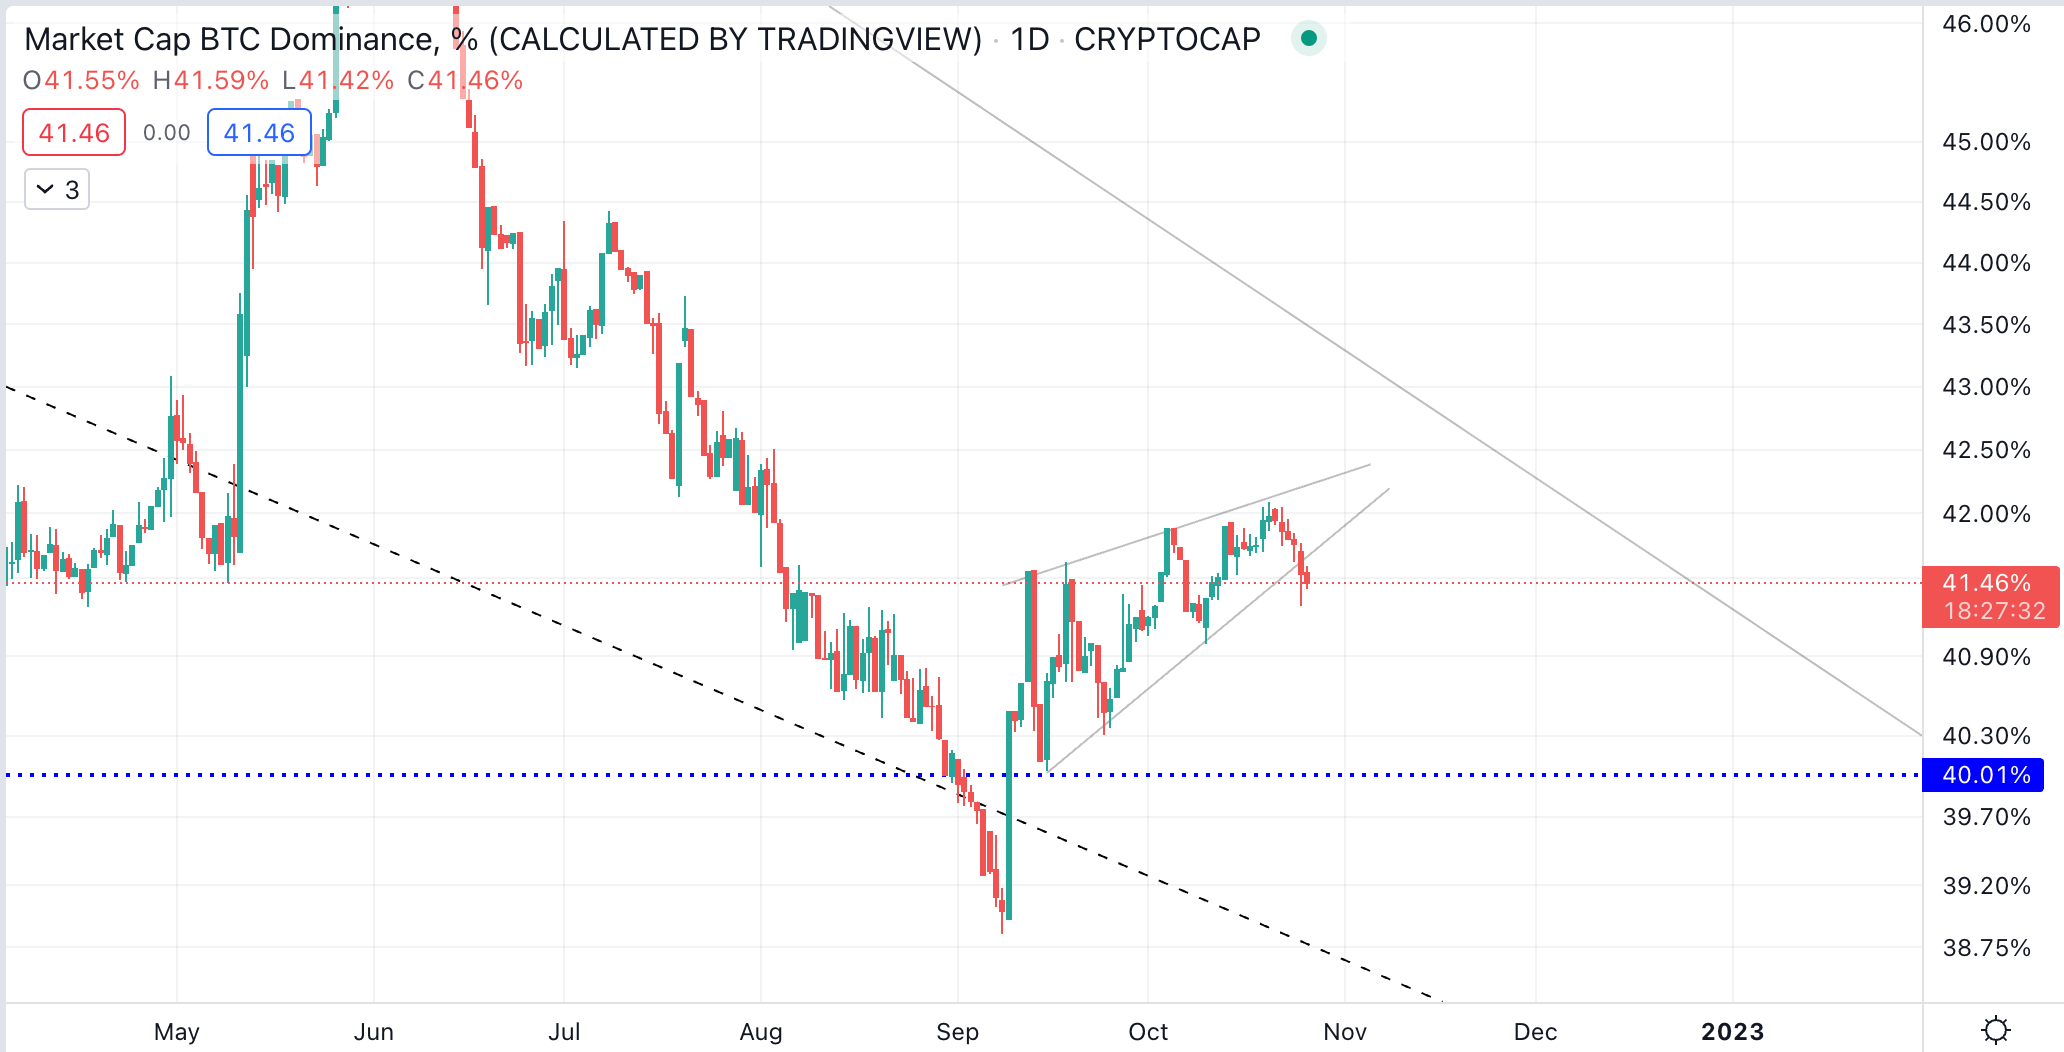
zooming out, heres a chart to highlight key support/resistance level, one can say that we are close to a big move in btc.d towards the year end. below 40% alt coins outperforms, a break above its diagonal resistance = BTC king.
Given how volatile things tend can be in lower time frames, we shall take things one step at a time, as usual stay safu.